

Executive Summary
- Passive strategies are often seen as sensible in efficient markets, however the diversity in Asian markets offers fertile ground for active strategies
- Less coverage and transparency in Asian markets create opportunities for active managers to add value
- Asian managers have higher average alpha compared to US counterparts, highlighting the potential for outperformance in under covered markets
In an industry that so often sets the academic versus the market practitioner, theory versus practice, and skill versus luck, it is fair to say that the most enduring argument for well over 50 years1 centres on the efficiency (or lack of it) of equity markets. To believe markets are inefficient is to be able to argue that it is feasible to outperform a benchmark, to disagree means that index tracking offers the most sensible course of investing.
However, like many aspects of life, the reality is often more nuanced than what headlines or academics might suggest. The passive, index tracking community explicitly (or implicitly) believes that markets must offer little scope for outperformance, making passive strategies a sensible choice. For sure, plenty of data exists to make the case that beating the S&P 500 is a challenging task - though there are outliers that show it is possible.
That said, it is important to note that in the US, there is a high level of real time information, price transparency and analysts’ coverage of US stocks, all of which are lacking in the context of many Emerging and Asian Markets. This is why up till now the answer to this commonly asked finance exam question ‘Are emerging markets efficient? is 'No.'
US markets reign superior
The most recent years have been driven by exceptionally strong returns for the US markets (as shown by the S&P 500). However, these results have been driven by a few stocks, limiting the benefits of research and active management. It also suggests that the narrow set of US stocks is the ‘only game in town.’ But such a conclusion precludes two key considerations:
- Are there other non-US listed stocks that have also performed very strongly?
- Will this narrow set of US stocks continue to outperform in 2025 and beyond?
Fig 1 could argue the case for either side of this argument. While only 15% of companies globally did better than our narrow list of very high US performers, when we look at a country level, delve into markets or perhaps consider the limitations imposed by the index in this case, we can make a case that there are several hundred stocks that actually did better; with many of these in markets across Asia.
Additionally, an Emerging Market or Asian manager seeking to invest in a portfolio of stocks to outperform their relevant benchmark is focused over time (long-term investing) in companies that deliver better than market returns. They are not influenced per se by the market return of the best stocks in the US but may well take note of the themes and ideas that drive them of course.
Fig 1: Only 15% of companies globally have outperformed the Mag 7 in 2024
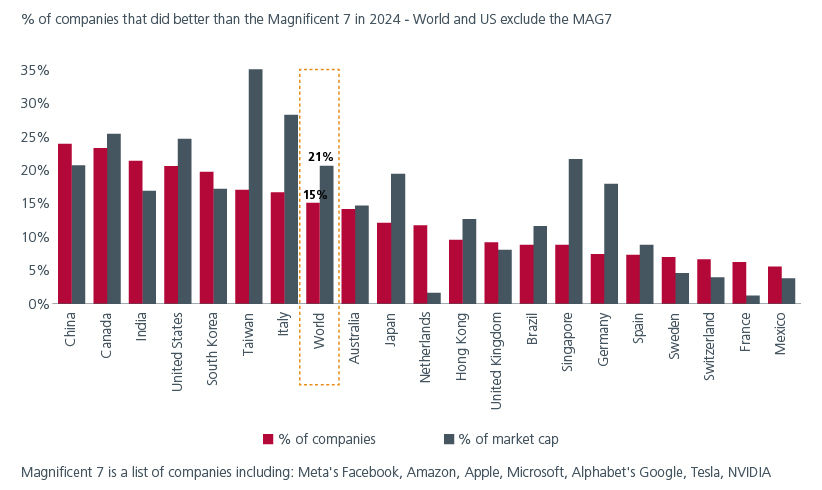
Source: Goldman Sachs, Datastream, Nov 2024
Undercovered markets offer active opportunities
For fundamental equity investors, active management focuses on bottom-up research. Portfolio managers and analysts examine a company's balance sheet, business model, management, and strategy. Stocks vary widely in size and industry, influenced by local and global economic factors. The core argument for active management is that markets often underappreciate a company's potential due to changing and inefficient dynamics.
It has often been argued that in the US large cap space, extensive coverage by brokers and participants means there is little unknown about each stock, limiting the information advantage for buy-side analysts or portfolio managers. This coverage argument becomes significantly more tenuous in Asia, where 41% of the ASEAN market remains uncovered by traditional sell-side analysts. See Fig 2.
Fig 2: Large opportunity in under covered ASEAN stocks
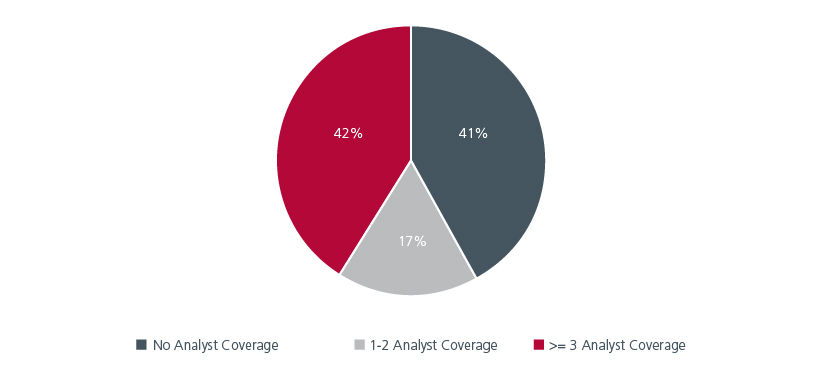
Source: Eastspring Investments (Singapore) Limited as of 19 Aug 2024. Includes firms in ASEAN markets with market cap of more than USD100m and average daily turnover of more than USD0.5m
Even in Japan, a developed market, there is lack of analyst coverage for the small and mid-cap (SMID) stocks. Although small-cap stocks represent over 80% of the Japan equity universe2, they are often under researched. See Fig 3. The amount of sell-side analyst coverage is a good proxy for the market’s focus; within the TOPIX Small Index, over half of the names are being covered by one analyst at most.
Fig 3: Limited sell-side coverage for SMID stocks in Japan
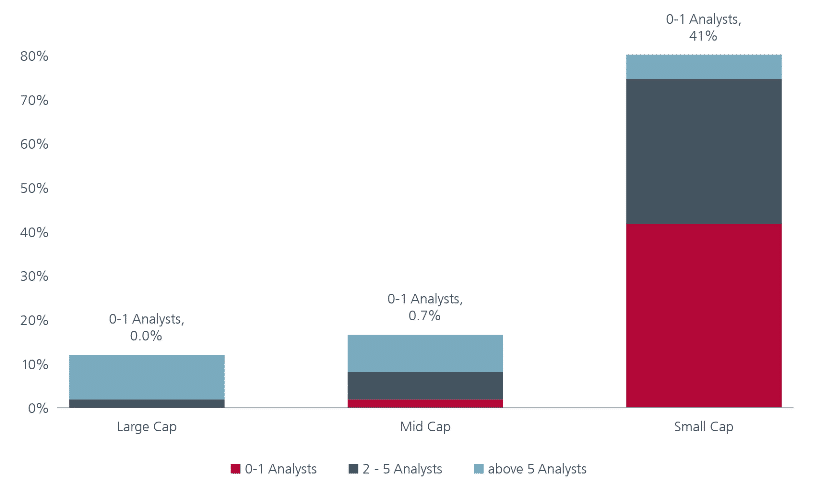
Source: Eastspring Investments, Nomura, based on IFIS and MSCI data, as of 30 September 2024. The universe data is based on the MSCI Japan Large Cap Index, MSCI Japan Mid Cap Index and MSCI Japan Small Cap Index.
This limited coverage should mean greater value can be added by the manager prepared to do the work. Historically this was also seen in the excess return that might be expected from an active strategy outside of developed markets.
Data from eVestment shows that Asia managers have a clear ‘alpha advantage” over their US counterparts. Their average alpha is 2.15% against the manager-defined benchmark and 2.09%3 against the MSCI AC Asia ex Japan. In contrast, US managers have an average alpha of 0.83% against their benchmark, which turns negative at -0.72% when compared to the S&P 500. See Fig 4.
Fig 4: Average alpha higher in Asia ex-Japan equity strategies
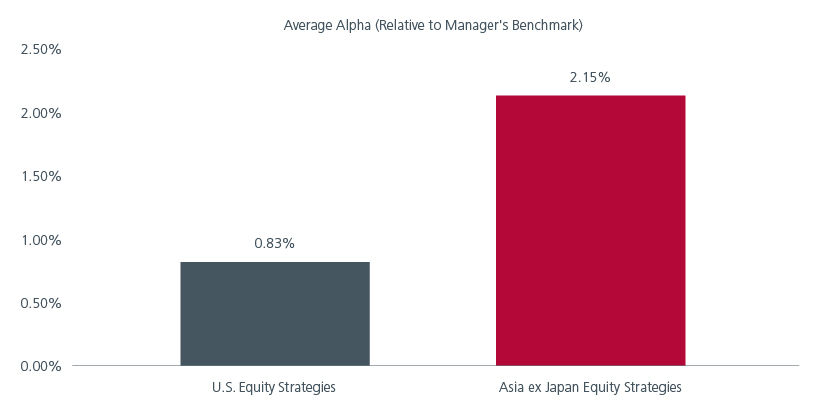
Source: eVestment Dec 2024
Where do these ‘alpha’ stocks exist?
Markets in Asia are a blend of developed ones such as Hong Kong and Singapore and developing countries such as Indonesia, Vietnam, etc. This diversity provides breadth, depth, and inefficiency for managers to exploit and explore themes impacting global markets i.e. technology and artificial intelligence, supply chains, healthcare, and demographics.
The case for long-term investing in Asia is compelling. Apart from being the fastest-growing region, Asia stands out in many other areas. Asia is the world’s largest trading region; its population is almost 60% of the world’s total and the region is fast becoming a hub for global technology and industrial innovation. Despite being a powerhouse in many aspects, the region is under represented in global financial indices. As of June 2024, Asia ex-Japan equity markets comprised just under 9% of the MSCI AC World Index.4
Many of the Asian markets also offer attractive entry points at current valuations. Fig 5 makes the case that current valuation levels for the broad Asia index are roughly aligned to the 20- year average, and there have been periods where Asian markets have traded higher in this range.
The interesting comparison is with developed markets, where current valuations are well above historical averages. Markets are currently navigating a variety of geopolitical challenges. Our view remains that policy lags, uncertainty over inflation, and the path of interest rates will lead to higher market volatility but also present opportunities. Against this backdrop, stock picking will be key in Emerging and Asian Markets.
Fig 5: Asian markets are attractively valued
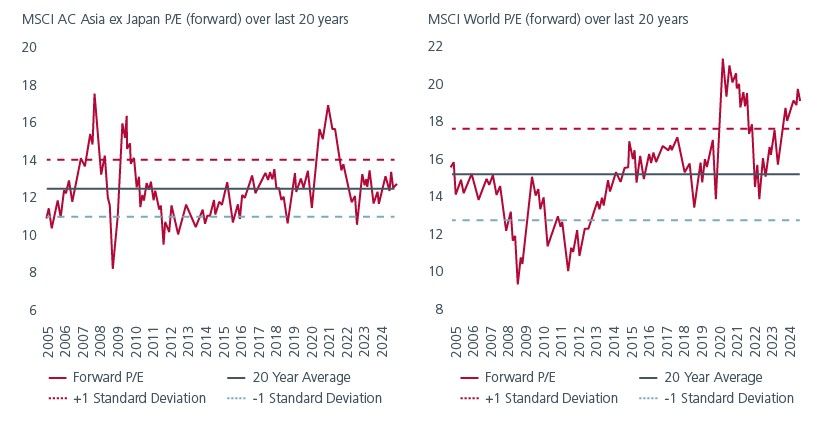
Source: Eastspring Investments (Singapore) Limited, Refinitiv, using MSCI indices, monthly data to 31 December 2024. P/E: Price to Earnings.
In 2024, the Asia Pacific region maintained its position as the largest region for initial public offerings (IPOs), both in proceeds and volume. Asian markets thus offer several thousand stocks to invest in; some are domestic in nature while others have a regional or global exposure.
The ability of an asset manager to conduct on-the ground research of a market opens access to stocks beyond what is available in an index. While this requires patience and an in depth understanding of each market’s nuances, the rewards can be handsome. Within the ASEAN universe we see that in the mid and small cap segment, a healthy percentage of stocks showed very meaningful gains when compared to the large cap end of the universe. See Fig 6.
Fig 6: Higher percentage of mid and small cap stocks show significant gains
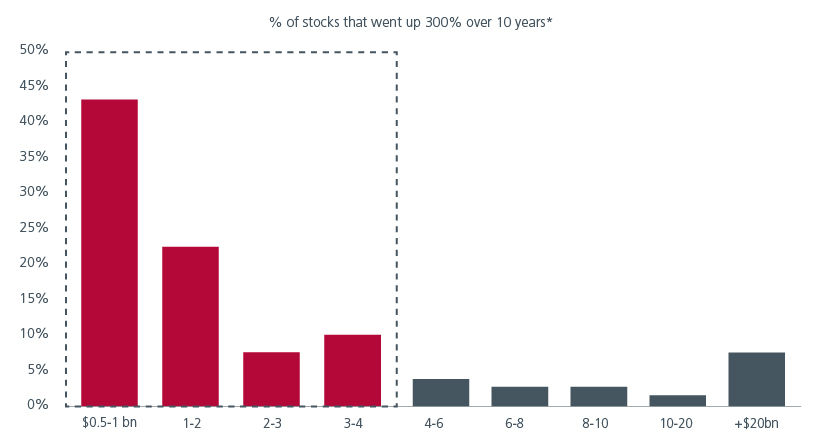
Source: Eastspring Investments as of 19 Aug 2024. Includes firms in ASEAN markets with market cap of more than USD100m and average daily turnover of more than USD0.5m. *Data from Jan 2014 to Dec 2023, ASEAN universe.
Harnessing alpha via data driven strategies
The diverse and less covered nature of many Asian markets, in particular, too provides a fertile ground for active quantitative strategies to explore alpha systematically. Some of the well-researched and widely adopted factor risk premiums have proven to be more efficacious in Emerging and Asian Markets. Furthermore, quantitative investing’s emphasis on data-driven insights, rigorous scientific testing of investment ideas, and the utilisation of advanced modelling techniques, such as Machine Learning (ML) and Natural Language Processing (NLP), allows these strategies to adapt quickly to changing market conditions, enhancing their potential to outperform traditional benchmarks.
Fig 7: Factors perform strongly in the Asia Pacific ex Japan region
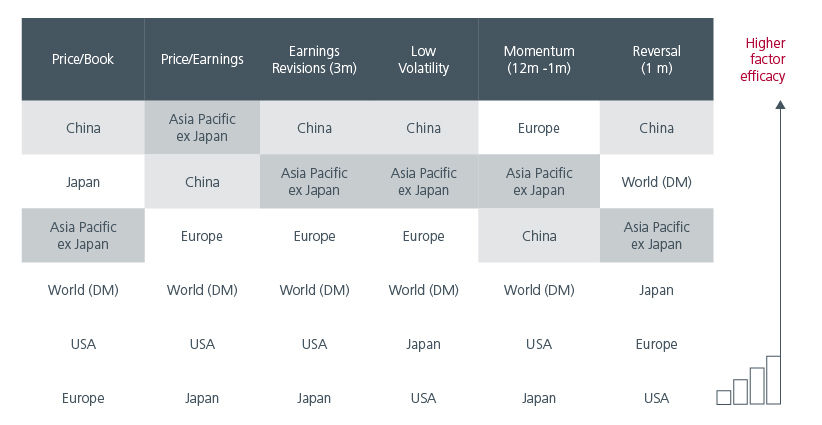
Source: Eastspring Investments, Bloomberg, MSCI as of 31 Oct 2024
All said, statistics show that investor preference for indexing has continued to rise over recent years. Academic work equally supports the notion that there are years when the index is the best place to invest as stock price momentum and the largest capitalisation stocks represent the best opportunity; over recent quarters this may well have been the case for those looking at the US market. However, as per Fig 6, the opportunity for alpha in less efficient markets with a broad diversity of stocks still exists in Asia.
Interesting reads


Sources:
1 If you take the original work of Louis Bachelier on the topic then over 100 years!
2 Defined by MSCI Japan market capitalisation index suite as of 30 September 2024.
3 Data
Source: eVestment: Asia ex Japan universe: 141 products, analysing period: 2010 to 2023, annualised excess return, All US Equity universe: 3700 products and Analysing period: 2010 to 2023, annualised excess return
4 https://www.msci.com/research-and-insights/visualizing-investment-data/acwi-imi-complete-geographic-breakdown
The information and views expressed herein do not constitute an offer or solicitation to deal in shares of any securities or financial instruments and it is not intended for distribution or use by anyone or entity located in any jurisdiction where such distribution would be unlawful or prohibited. The information does not constitute investment advice or an offer to provide investment advisory or investment management service or the solicitation of an offer to provide investment advisory or investment management services in any jurisdiction in which an offer or solicitation would be unlawful under the securities laws of that jurisdiction.
Past performance and the predictions, projections, or forecasts on the economy, securities markets or the economic trends of the markets are not necessarily indicative of the future or likely performance of Eastspring Investments or any of the strategies managed by Eastspring Investments. An investment is subject to investment risks, including the possible loss of the principal amount invested. Where an investment is denominated in another currency, exchange rates may have an adverse effect on the value price or income of that investment. Furthermore, exposure to a single country market, specific portfolio composition or management techniques may potentially increase volatility.
Any securities mentioned are included for illustration purposes only. It should not be considered a recommendation to purchase or sell such securities. There is no assurance that any security discussed herein will remain in the portfolio at the time you receive this document or that security sold has not been repurchased.
The information provided herein is believed to be reliable at time of publication and based on matters as they exist as of the date of preparation of this report and not as of any future date. Eastspring Investments undertakes no (and disclaims any) obligation to update, modify or amend this document or to otherwise notify you in the event that any matter stated in the materials, or any opinion, projection, forecast or estimate set forth in the document, changes or subsequently becomes inaccurate. Eastspring Investments personnel may develop views and opinions that are not stated in the materials or that are contrary to the views and opinions stated in the materials at any time and from time to time as the result of a negative factor that comes to its attention in respect to an investment or for any other reason or for no reason. Eastspring Investments shall not and shall have no duty to notify you of any such views and opinions. This document is solely for information and does not have any regard to the specific investment objectives, financial or tax situation and the particular needs of any specific person who may receive this document.
Eastspring Investments Inc. (Eastspring US) primary activity is to provide certain marketing, sales servicing, and client support in the US on behalf of Eastspring Investment (Singapore) Limited (“Eastspring Singapore”). Eastspring Singapore is an affiliated investment management entity that is domiciled and registered under, among other regulatory bodies, the Monetary Authority of Singapore (MAS). Eastspring Singapore and Eastspring US are both registered with the US Securities and Exchange Commission as a registered investment adviser. Registration as an adviser does not imply a level of skill or training. Eastspring US seeks to identify and introduce to Eastspring Singapore potential institutional client prospects. Such prospects, once introduced, would contract directly with Eastspring Singapore for any investment management or advisory services. Additional information about Eastspring Singapore and Eastspring US is also is available on the SEC’s website at www.adviserinfo.sec. gov.
Certain information contained herein constitutes "forward-looking statements", which can be identified by the use of forward-looking terminology such as "may", "will", "should", "expect", "anticipate", "project", "estimate", "intend", "continue" or "believe" or the negatives thereof, other variations thereof or comparable terminology. Such information is based on expectations, estimates and projections (and assumptions underlying such information) and cannot be relied upon as a guarantee of future performance. Due to various risks and uncertainties, actual events or results, or the actual performance of any fund may differ materially from those reflected or contemplated in such forward-looking statements.
Eastspring Investments companies (excluding JV companies) are ultimately wholly-owned / indirect subsidiaries / associate of Prudential plc of the United Kingdom. Eastspring Investments companies (including JV’s) and Prudential plc are not affiliated in any manner with Prudential Financial, Inc., a company whose principal place of business is in the United States of America.