


Global Emerging Markets Equity Team
Eastspring Investments
Executive Summary
- Tariffs will increase inflation, reduce consumption and hurt business investment spending in the US. Slower economic and earnings growth no longer justify US equities’ premium valuations. We expect the S&P 500 to derate.
- Emerging Markets’ cheap valuations and increasingly favourable growth differential versus the Developed Markets position it well to capture some of the diversification flows from US equities.
- We are no strangers to volatility and remain focused on identifying quality names at depressed valuations. We are looking at markets that can deliver policy stimulus as well as selected bright spots within Latin America.
US tariff changes continue to create uncertainty. The 90-day pause on tariffs, except for China, and the announced exemptions illustrate the unpredictability of US trade policy. What might unfold between now and the end of the 90-day pause in July remains unclear.
That aside, the current effective US tariff rate is still close to 20%, up from 2.4% last year. This will increase inflation, reduce consumption by reducing real incomes, and damage business investment spending in the US. As such, US growth is expected to come in at sub-1% this year with a negative effect on corporate earnings. This slower growth is likely to persist into 2026.
With US equities still priced at a premium at a 12-month forward price to earnings ratio of around 20x, sub trend US growth for the next 12 to 18 months suggests that US equities should de-rate to at least its 35-year historical trading average of 18x. Given the significant weightings in US equities among global portfolios (See Fig. 1), investors are likely to seek greater diversification.
Fig. 1. Investors are massively OW US equities
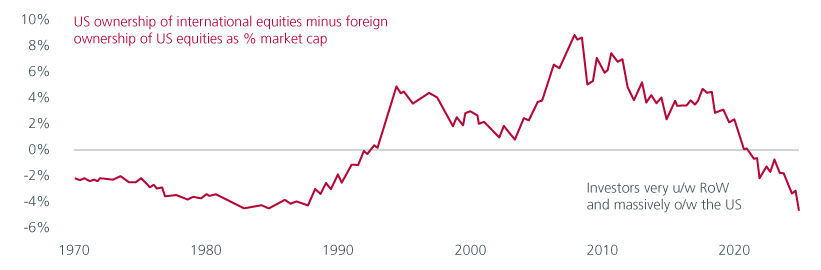
Source: Federal Reserve. HSBC. April 2025.
EM is well positioned
We believe that Emerging Markets (EMs) are well-positioned to attract some of these flows. For one, valuations are very cheap relative to the developed markets (DMs) (Fig. 2). We could also be at an inflection point where the growth differential between EMs and DMs stabilizes and potentially widens. Historically, EMs have outperformed DMs when this growth differential rises. See Fig. 3.
Fig. 2. MSCI EM relative to MSCI World trailing PB(x)
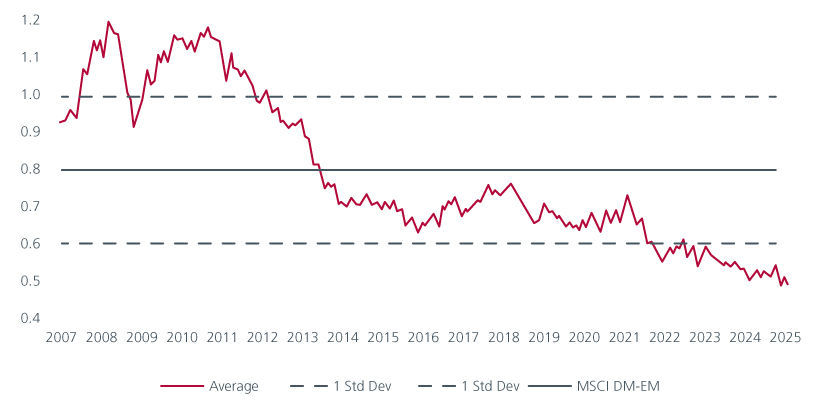
Source: MSCI. Refinitiv Datastream. Eastspring Investments. As of March 2025. Notes: PB = price to book. DM is MSCI World Index. EM is MSCI Emerging Market Index.
Fig. 3. EM vs DM: Relative performance vs growth differential
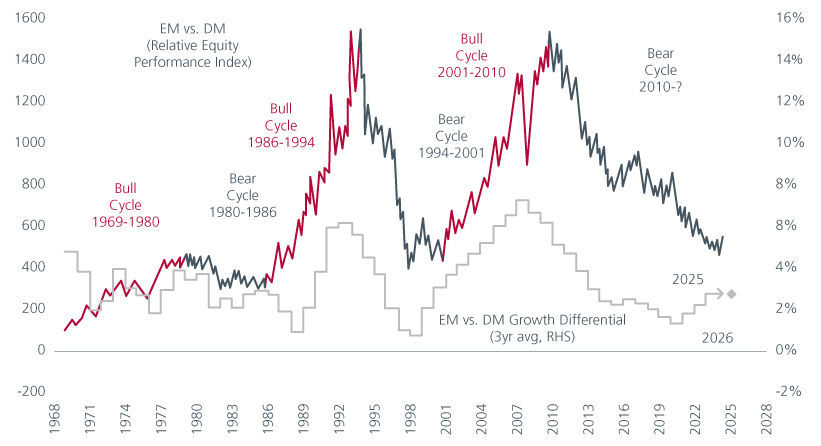
Source: FactSet, Goldman Sachs Global Investment Research. 7 April 2025.
Amid the recent heightened market volatility, it is interesting to note that the US dollar has declined 8.3% year to date, while other typical safe havens like gold and the Swiss franc have appreciated 26.0% and 10.0% respectively. With the Federal Reserve more likely to cut than to lift interest rates as US growth slows further, and given President Trump’s desire for a weaker dollar, a peak in the USD would be positive for EM assets, as long as investor risk appetite holds. Historically, EMs and the USD have shared an inverse relationship. Fig. 4.
Fig. 4. Emerging markets go up when the USD goes down
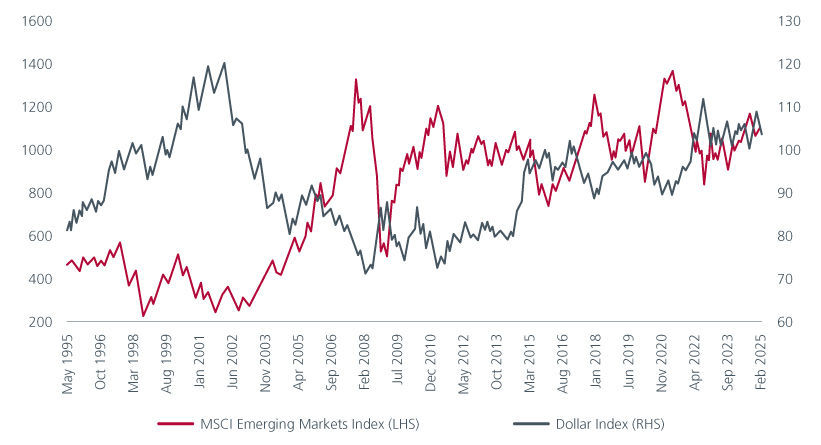
Source: Bloomberg. April 2025.
A weaker USD could boost higher carry EM currencies. It could also provide more room for rate cuts given EM central banks’ concerns about exchange rate stability and passthrough to inflation. We note that policy is already rapidly easing in Asia following recent moves by policymakers in India, Korea and Singapore. We expect the Bank of Korea and Bank of Thailand to cut rates again in the coming months. We see plenty of scope for easing in non-Asia EM too. A weaker USD could provide a positive feedback loop between lower rates, higher economic growth and capital inflows for EMs.
Emerging Markets in a post tariff world
While few countries have been spared from the US’ tariffs, there are relative winners within EMs. We are focusing on countries that can deliver policy stimulus to offset some of the tariff shock and markets where company specific factors are pushing up return on equity. In earlier commentaries, we had highlighted the potential for India and China to navigate the tariffs. We focus on Latin America (LatAm) and Central & Eastern Europe, Middle East and Africa (CEEMEA) in this article.
Prior to the 2nd April tariff announcements, LatAm currencies had depreciated more than those of EMEA and Asia. On a year on year basis, LatAm currencies have depreciated 15% against the USD, while EMEA and Asia FX have fallen 4% and 2.5%1. This was partly due to market expectations that the LatAm countries were going to be among the hardest hit by the tariffs within EMs. LatAm’s high goods revenue exposure to the US also exacerbated market concerns. Fig. 5.
Fig. 5. EM countries' revenue exposure to US
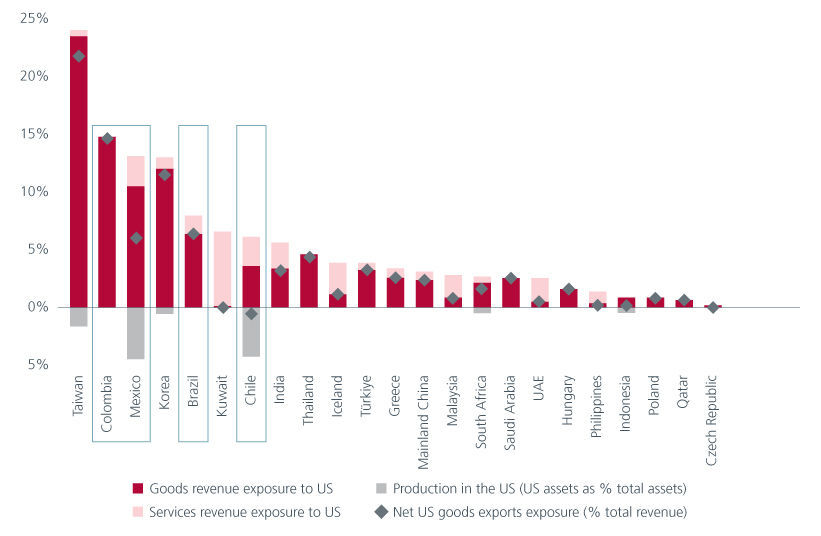
Source: FTSE Russell, Factset, HSBC. 20 February 2025.
However, the tariff announcements to date suggest that LatAm is a relative winner in the EMs. For one, the absence of incremental tariffs (at the point of writing) on Mexico was a positive surprise. For now, there are no tariffs on USMCA compliant goods; and while the US has slapped a 25% tariff on non-compliant goods; future exemptions could lower the effective tariff rate to 12%. Given the higher tariffs imposed on other manufacturing locations, the near shoring theme appears intact and should be positive for Mexico.
Brazil should also be less impacted by tariffs given its relatively closed economy – 80 to 85% of GDP is domestically driven. Historically, Brazilian equities have benefited from a weaker USD and lower rates. With the Brazilian and Mexico equity markets trading well below their historic averages, at 7.7x and 11.4x 2025 price to earnings respectively, we are finding fertile ground to find high quality names at depressed valuations. In particular, we like rate sensitive names in Brazil.
The CEEMEA region is also relatively less affected with a GDP-weighted average tariff of 11.4% although there is variability within the region. Reciprocal tariff rates for the larger markets in the Middle East like Qatar, Saudi Arabia and UAE are at the lower end at 10% although the region is expected to be hurt by lower oil prices. For Turkey, the outlook for Europe matters more as it exports more to the European Union (8.2% of GDP) than the US (1.2% of GDP). At the same time, Turkey could benefit from reshoring of manufacturing from China.
The CE3 economies (Poland, Czech Republic, and Hungary) face 20% tariffs that are consistent with the EU's rates. Both Poland and the Czech Republic have less than 1% of their revenues tied to the US, while Hungary, with approximately 1.6% of its revenues dependent on the US, is the most vulnerable due to its substantial auto manufacturing industry. Meanwhile, South Africa’s 30% tariff rates could end up lower following exemptions.
No stranger to volatility
EMs’ attractive valuations and increasing favourable growth differential versus the DMs position it well to benefit from a weaker USD and potential diversification flows away from US equities. While few countries have been spared from the US’ reciprocal tariffs, there is significant variability within EMs in terms of exposure to US revenues, potential market share gains/losses and central bank responses. This backdrop presents significant opportunities for active managers to add value. EM investors are no strangers to market volatility. We are accustomed to navigating the complexities and fluctuations inherent in these markets. As such, amid the market volatility, we continue to focus on delivering long-term alpha by staying disciplined and uncovering high quality names at depressed valuations.
Interesting reads


Sources:
1 As of 6 March 2025.
The information and views expressed herein do not constitute an offer or solicitation to deal in shares of any securities or financial instruments and it is not intended for distribution or use by anyone or entity located in any jurisdiction where such distribution would be unlawful or prohibited. The information does not constitute investment advice or an offer to provide investment advisory or investment management service or the solicitation of an offer to provide investment advisory or investment management services in any jurisdiction in which an offer or solicitation would be unlawful under the securities laws of that jurisdiction.
Past performance and the predictions, projections, or forecasts on the economy, securities markets or the economic trends of the markets are not necessarily indicative of the future or likely performance of Eastspring Investments or any of the strategies managed by Eastspring Investments. An investment is subject to investment risks, including the possible loss of the principal amount invested. Where an investment is denominated in another currency, exchange rates may have an adverse effect on the value price or income of that investment. Furthermore, exposure to a single country market, specific portfolio composition or management techniques may potentially increase volatility.
Any securities mentioned are included for illustration purposes only. It should not be considered a recommendation to purchase or sell such securities. There is no assurance that any security discussed herein will remain in the portfolio at the time you receive this document or that security sold has not been repurchased.
The information provided herein is believed to be reliable at time of publication and based on matters as they exist as of the date of preparation of this report and not as of any future date. Eastspring Investments undertakes no (and disclaims any) obligation to update, modify or amend this document or to otherwise notify you in the event that any matter stated in the materials, or any opinion, projection, forecast or estimate set forth in the document, changes or subsequently becomes inaccurate. Eastspring Investments personnel may develop views and opinions that are not stated in the materials or that are contrary to the views and opinions stated in the materials at any time and from time to time as the result of a negative factor that comes to its attention in respect to an investment or for any other reason or for no reason. Eastspring Investments shall not and shall have no duty to notify you of any such views and opinions. This document is solely for information and does not have any regard to the specific investment objectives, financial or tax situation and the particular needs of any specific person who may receive this document.
Eastspring Investments Inc. (Eastspring US) primary activity is to provide certain marketing, sales servicing, and client support in the US on behalf of Eastspring Investment (Singapore) Limited (“Eastspring Singapore”). Eastspring Singapore is an affiliated investment management entity that is domiciled and registered under, among other regulatory bodies, the Monetary Authority of Singapore (MAS). Eastspring Singapore and Eastspring US are both registered with the US Securities and Exchange Commission as a registered investment adviser. Registration as an adviser does not imply a level of skill or training. Eastspring US seeks to identify and introduce to Eastspring Singapore potential institutional client prospects. Such prospects, once introduced, would contract directly with Eastspring Singapore for any investment management or advisory services. Additional information about Eastspring Singapore and Eastspring US is also is available on the SEC’s website at www.adviserinfo.sec. gov.
Certain information contained herein constitutes "forward-looking statements", which can be identified by the use of forward-looking terminology such as "may", "will", "should", "expect", "anticipate", "project", "estimate", "intend", "continue" or "believe" or the negatives thereof, other variations thereof or comparable terminology. Such information is based on expectations, estimates and projections (and assumptions underlying such information) and cannot be relied upon as a guarantee of future performance. Due to various risks and uncertainties, actual events or results, or the actual performance of any fund may differ materially from those reflected or contemplated in such forward-looking statements.
Eastspring Investments companies (excluding JV companies) are ultimately wholly-owned / indirect subsidiaries / associate of Prudential plc of the United Kingdom. Eastspring Investments companies (including JV’s) and Prudential plc are not affiliated in any manner with Prudential Financial, Inc., a company whose principal place of business is in the United States of America.